National wastewater surveillance of SARS-CoV-2
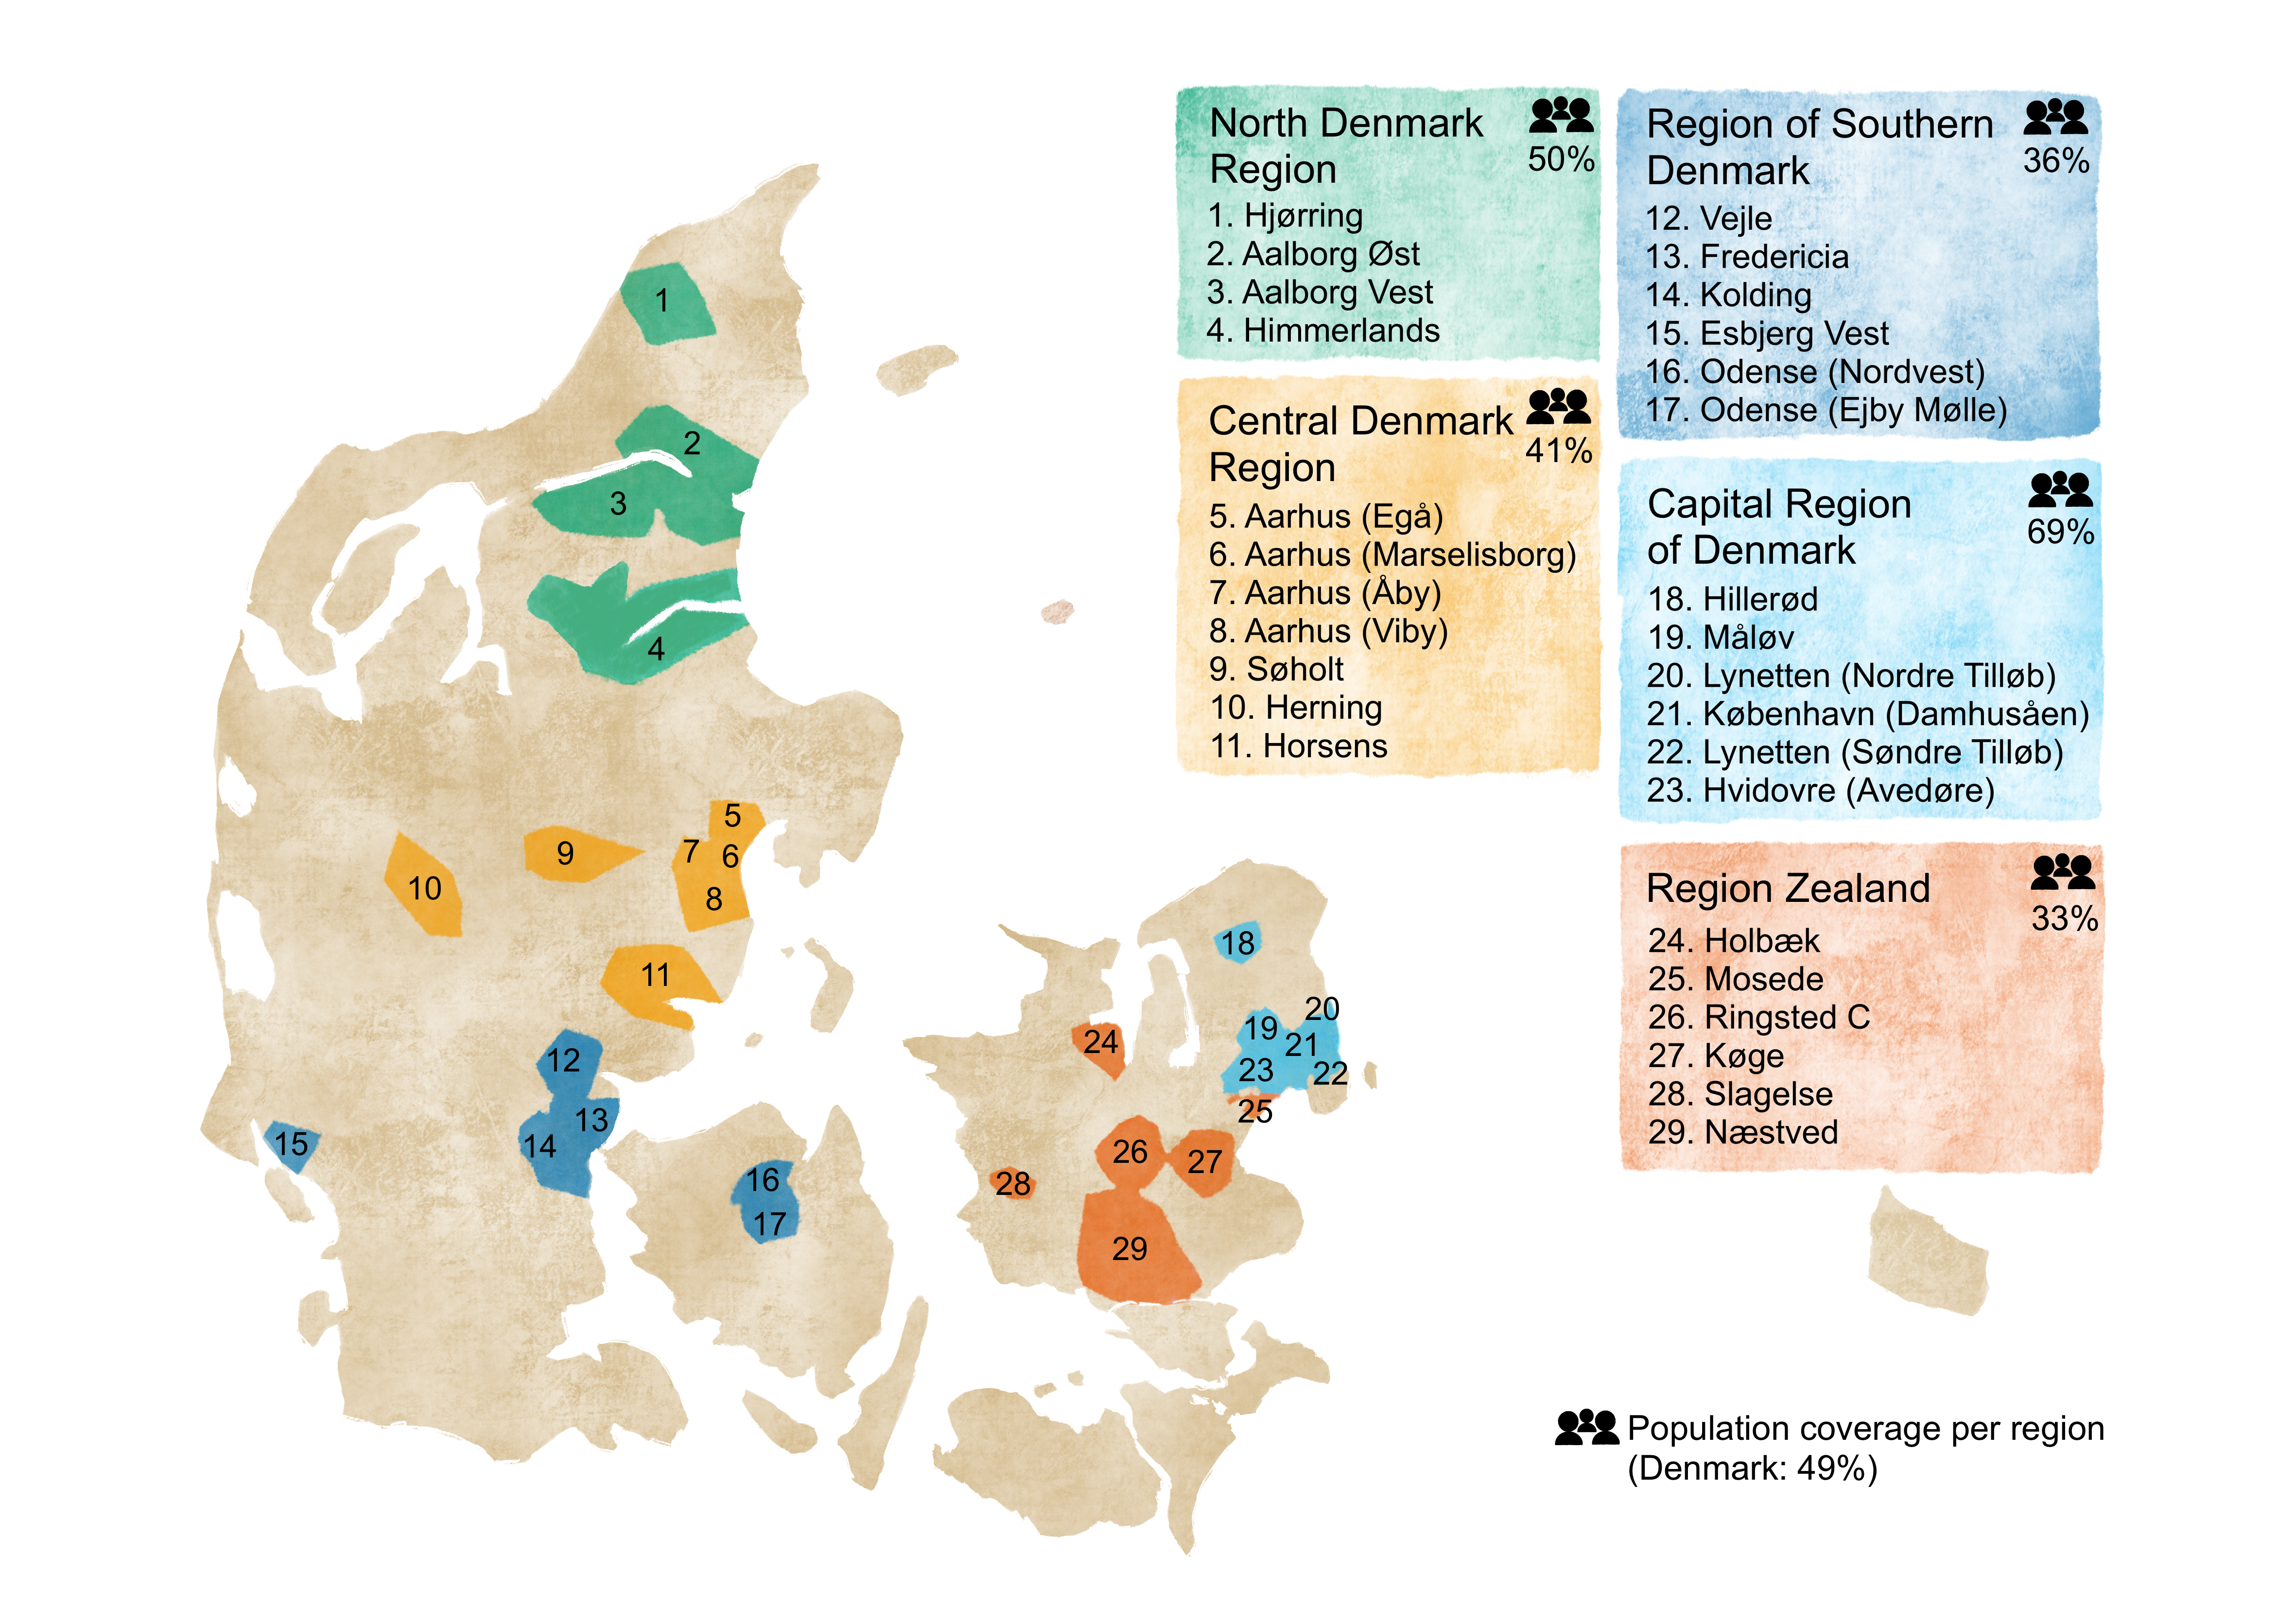
The national wastewater surveillance in Denmark covers 49% of the population. Wastewater samples are collected from 29 wastewater treatment plants distributed across the country, allowing the development of SARS-CoV-2 to be monitored both nationally and regionally.
SARS-COV-2 status in wastewater as of 15.07.2026
In week 28 (July 6 - July 12) the national SARS-CoV-2 concentration in wastewater, indicating the amount of SARS-CoV-2 circulating in the population, is at a very low level.
In all five regions, the concentration is likewise at a very low level.
The national growth rate, which is the average weekly growth over the past four weeks (June 15 - July 12), is not calculated this week due to increased uncertainty caused by very low concentrations.
National concentration of SARS-CoV-2 in wastewater over time and the current growth rate
The figure below shows the concentration levels of SARS-CoV-2 in wastewater across all sampling locations, as well as this week's growth rate. The growth rate is categorized as follows:
- Very strong increase (> 50%)
- Strong increase (25% to 49%)
- Increase (10% to 24%)
- No growth (-9% to 9%)
- Decrease (-24% to -10%)
- Strong decrease (-49% to -25%)
- Very strong decrease (< -50%)

Regional concentration levels of SARS-CoV-2 in wastewater and development over time
The figure below shows the level of SARS-CoV-2 in wastewater for each region, along with the regional development of SARS-CoV-2 concentration over time.

Download wastewater data
Data from the national wastewater surveillance (15.07.2026)
Information on the National Wastewater Surveillance
How is the national wastewater surveillance conducted?
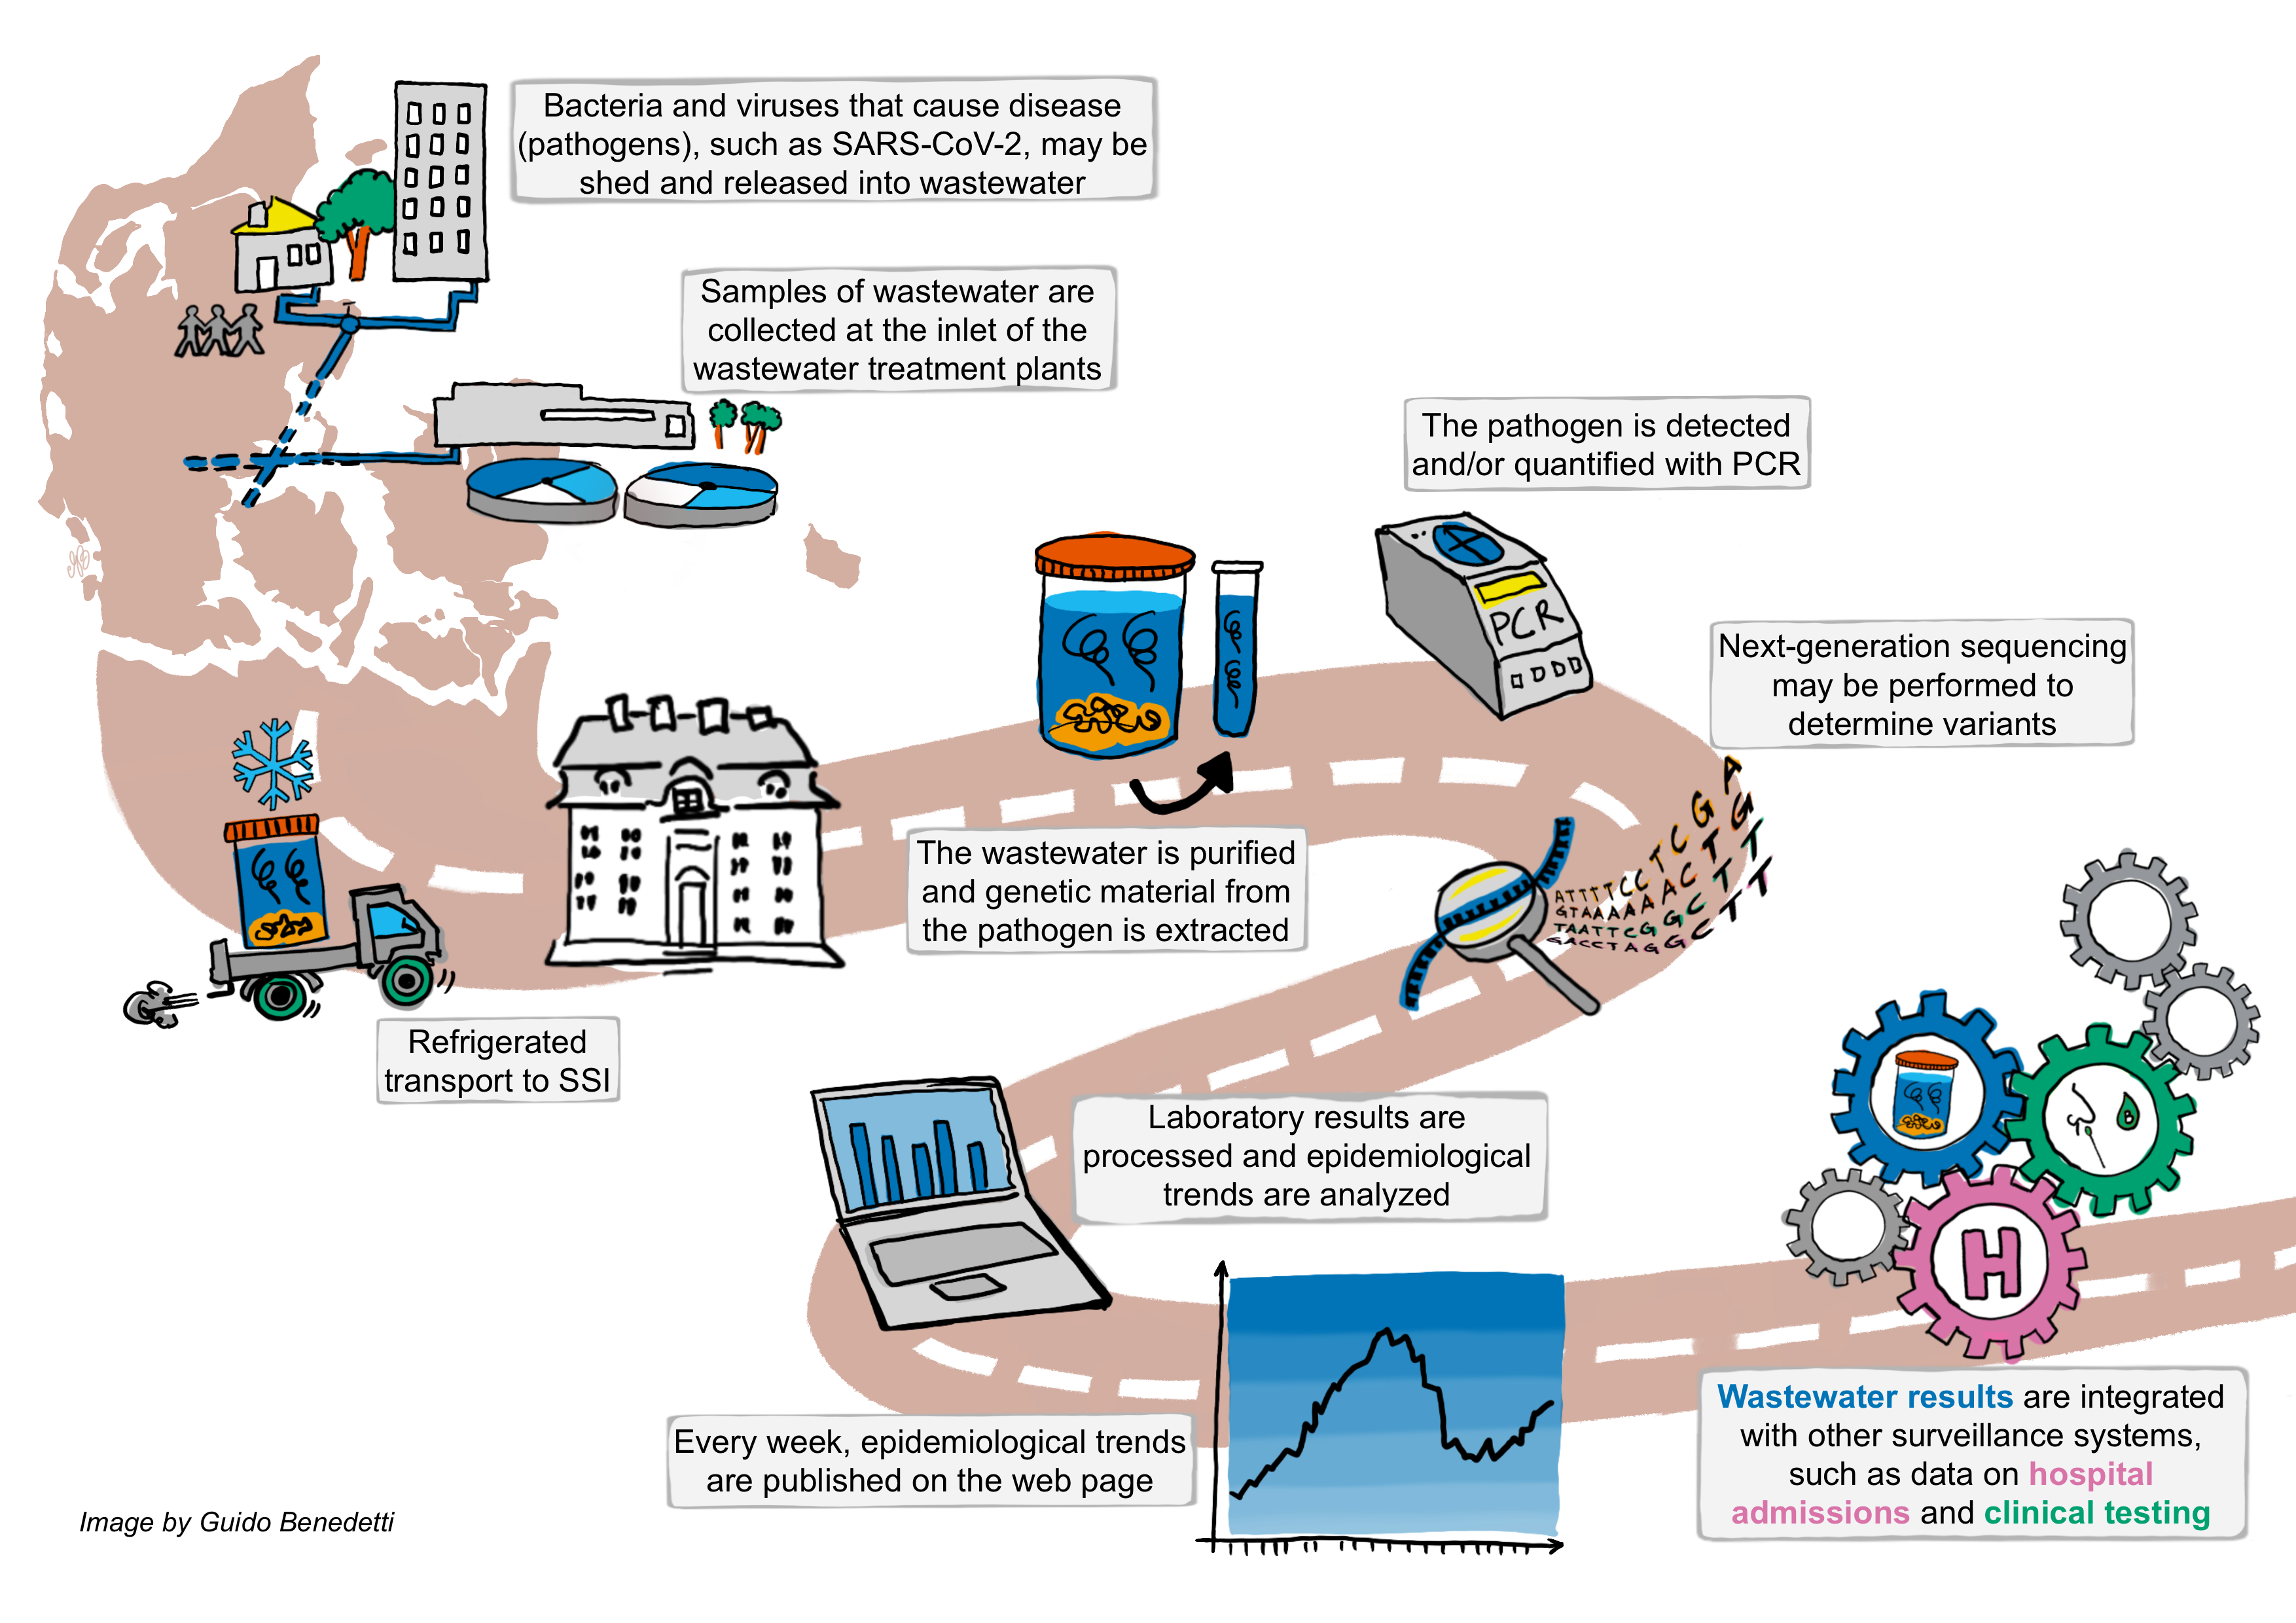
Where are viruses measured in wastewater?
How are viruses measured in wastewater?
How are the wastewater measurement results reported?
Where can I learn more about the national wastewater surveillance?
Publications
Exploring bilateral collaboration for enhanced pandemic preparedness: A pilot study on joint wastewater surveillance in Denmark and Norway. Madslien, E. H., Krogsgaard, L. W., Gudde, A., Petrovic, K., Larsen, N. B., Shaw, D. S., Benedetti, G., & Hyllestad, S. (2026). Science of the Total Environment, 1027, 181654. https://doi.org/10.1016/j.scitotenv.2026.181654
Predicting hospital admissions due to COVID-19 in Denmark using wastewater-based surveillance. Gudde, A., Krogsgaard, L. W., Benedetti, G., Schierbech, S. K., Brokhattingen, N., Petrovic, K., Rasmussen, L. D., Franck, K. T., Ethelberg, S., Larsen, N. B., & Christiansen, L. E. (2025). Science of the Total Environment, 966, 178674. https://doi.org/10.1016/j.scitotenv.2025.178674
A survey of the representativeness and usefulness of wastewater-based surveillance systems in 10 countries across Europe in 2023. Benedetti, G., Wulff Krogsgaard, L., Maritschnik, S., Stüger, H. P., Hutse, V., Janssens, R., Blomqvist, S., Pitkänen, T., Koutsolioutsou, A., Róka, E., Vargha, M., La Rosa, G., Suffredini, E., Cauchie, H. M., Ogorzaly, L., van der Beek, R. F., Lodder, W. J., Madslien, E. H., Baz Lomba, J. A., & Ethelberg, S. (2024). Euro surveillance: European communicable disease bulletin, 29(33), 2400096. https://doi.org/10.2807/1560-7917.ES.2024.29.33.2400096
Results from the SARS-CoV-2 wastewater-based surveillance system in Denmark, July 2021 to June 2022. Krogsgaard, L. W., Benedetti, G., Gudde, A., Richter, S. R., Rasmussen, L. D., Midgley, S. E., Qvesel, A. G., Nauta, M., Bahrenscheer, N. S., von Kappelgaard, L., McManus, O., Hansen, N. C., Pedersen, J. B., Haimes, D., Gamst, J., Nørgaard, L. S., Jørgensen, A. C. U., Ejegod, D. M., Møller, S. S., ... Ethelberg, S. (2024). Water Research, 252. https://doi.org/10.1016/j.watres.2024.121223
Detection of Sequencing Reads from 5’-End Genomic and Subgenomic SARS-CoV-2 RNAs in Wastewater Sampled, Extracted and Sequenced Directly from Aircrafts, Airport Buildings, or Regular Wastewater Treatment Plants. Tang, M.-H. E., Bennedbaek, M., Gunalan, V., Qvesel, A. G., Thorsen, T. H., Rasmussen, L. D., Krogsgaard, L. W., Rasmussen, M., Stegger, M., & Alexandersen, S. (2023). Heylion 2024, May 15. https://doi.org/10.1016%2Fj.heliyon.2024.e29703
Early detection of local SARS-CoV-2 outbreaks by wastewater surveillance: A feasibility study. Nauta, M., McManus, O., Træholt Franck, K., Lindberg Marving, E., Dam Rasmussen, L., Raith Richter, S., Ethelberg, S. (2023) Epidemiology & Infection, 151, e28. https://doi.org/10.1017/S0950268823000146
First cases of SARS-CoV-2 BA.2.86 in Denmark, 2023. Rasmussen, M., Møller, F. T., Gunalan, V., Baig, S., Bennedbæk, M., Christiansen, L. E., Cohen, A. S., Ellegaard, K., Fomsgaard, A., Franck, K. T., Larsen, N. B., Larsen, T. G., Lassaunière, R., Polacek, C., Qvesel, A. G., Sieber, R. N., Rasmussen, L. D., Stegger, M., Spiess, K., Tang, M. E., … Jokelainen, P. (2023). Euro surveillance: European communicable disease bulletin, 28(36), 2300460. https://www.eurosurveillance.org/content/10.2807/1560-7917.ES.2023.28.36.2300460
Wastewater Surveillance in Europe for Non-Polio Enteroviruses and Beyond. Bubba, L., Benschop, K. S. M., Blomqvist, S., Duizer, E., Martin, J., Shaw, A. G., Bailly, J. L., Rasmussen, L. D., Baicus, A., Fischer, T. K., & Harvala, H. (2023). Microorganisms, 11(10), 2496. https://doi.org/10.3390/microorganisms11102496
SARS-CoV-2 Variants BQ.1 and XBB.1.5 in Wastewater of Aircraft Flying from China to Denmark, 2023. Qvesel, A. G., Bennedbæk, M., Larsen, N. B., Gunalan, V., Krogsgaard, L. W., Rasmussen, M., & Rasmussen, L. D. (2023).Emerging Infectious Diseases, 29(12). https://doi.org/10.3201/eid2912.230717
Predicting COVID-19 Incidence Using Wastewater Surveillance Data, Denmark, October 2021-June 2022. McManus, O., Christiansen, L. E., Nauta, M., Krogsgaard, L. W., Bahrenscheer, N. S., von Kappelgaard, L., Christiansen, T., Hansen, M., Hansen, N. C., Kähler, J., Rasmussen, A., Richter, S. R., Rasmussen, L. D., Franck, K. T., & Ethelberg, S. (2023). Emerging Infectious Diseases, 29(8). https://doi.org/10.3201/eid2908.221634