No 12b - 2023
COVIDmeter 2020-2022
COVIDmeter 2020-2022
COVIDmeter is a tool for monitoring COVID-19 in the community based on weekly notifications of symptoms from a permanent citizens’ panel. As of spring of 2020, COVIDmeter has contributed weekly disease symptom data that have been published on the SSI website. COVIDmeter works owing to a panel of volunteer citizens who visit a website every week where they tick off a number of questions to state if they have had any of a range of symptoms. Subsequently, Statens Serum Institut (SSI) estimates the proportion of weekly respondents with ‘probably COVID-19’.
COVIDmeter is a monitoring system that provides near-real-time information about the development of the epidemic. It is independent of recommendations and SARS-CoV-2 testing offers in the community and also independent of any contact that the participants may have to the healthcare services. Below, we briefly describe the main findings obtained along with the benefits and drawbacks of the system.
Background and structure
In the initial weeks of the COVID-19 epidemic, the SSI started establishing a range of monitoring systems to obtain knowledge about the manifestation and prevalence of the new condition. One of these systems consisted in establishing a large “cohort” of citizens who would access a safe IT system weekly to report any symptoms they may have had; symptoms that may in principle be consistent with COVID-19. COVIDmeter was developed in the course of March 2020 and was launched on 8 April 2020 during a period in which the SARS-CoV-2 testing capacity was still very limited and when part of the population clearly had a desire to contribute to learning more about the disease.
Since then, COVIDmeter has collected data continuously. The system works by allowing participants to complete an online questionnaire weekly. Citizens who have signed up receive a weekly e-mail with a link and a reminder that it is now time to complete the week’s COVIDmeter questionnaire. If the questionnaire is not completed, a reminder e-mail is sent the next day. The citizen accesses the website via Sundhed.dk and logs on using MitID (previously NemID). The questionnaire is brief and if the citizen answers “no”, only four questions need to be answered, which are all presented on a single page that can be completed in less than 10 seconds. The questionnaire invites the participant to state if, within one week, he or she has experienced recent disease, symptoms (relevant to COVID-19), use of the healthcare system in this connection, and if the participant has come into contact with other people who were infected with SARS-CoV-2 and, if so, where this occurred. Finally, participants are asked about testing, testing indication and vaccination. Answers are pseudo-anonymous, i.e. the SSI does not know the identity of the citizens, and the SSI also does not have access to the citizens’ e-mail addresses as they are encrypted. However, all users of the system have a unique number that makes it possible to link the user’s answers from one week to the next. Additionally, the users have answered a fundamental questionnaire why their self-reported age, sex, municipality of residence and basic health information are known.
To estimate the infectious pressure, a case definition was developed, which is used to assess who among the participants may have COVID-19, based on the symptoms they have experienced. On this basis, the SSI calculates the current weekly percentage share of contesting citizens with “possible COVID-19”.
The participating citizens
The first completed questionnaires were received in Week 15/2020. From Week 15/2020 to Week 52/2022, a total of approx. 140,000 citizens had been signed up. When the system was launched, a total of approx. 120,000 citizens signed up - but stable participation quickly declined, i.e. the number of citizens who answered the questionnaire every week dropped to about half the initial number of participants. In the course of 2020, the SSI received a mean 57,000 completed questionnaires a week. In 2021, the mean number of completed questionnaires declined to 40,000 per week, whereas the mean number of completed questionnaires in 2022 was 25,000 per week. The weekly number completed questionnaires is shown in Figure 1.
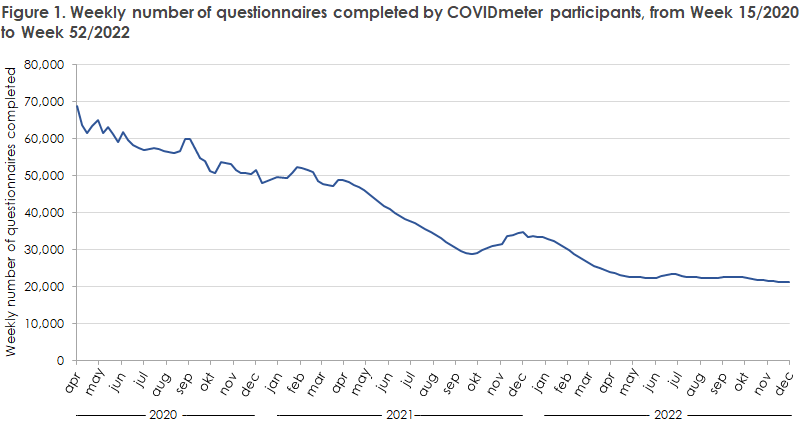
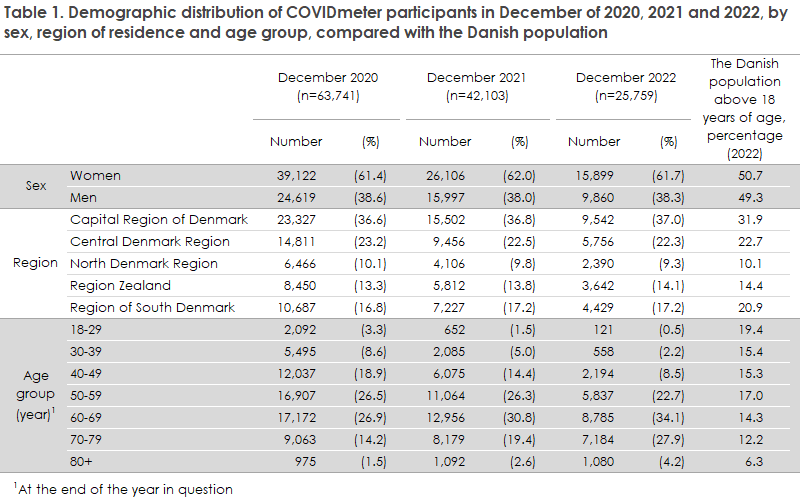
Table 1 presents the demographic distribution of COVIDmeter participants in December of 2020, 2021 and 2022, including all citizens who completed the questionnaire at least once in the course of the month. Citizens were able to participate only if they could log in using NemID/MitID, which effectively meant that the study population of the system was comprised by adult citizens. Anyone could sign up to participate, but the distribution of citizens who actually did sign up was skewed compared with the Danish population with respect to sex and age. Table 1 shows that women and, in particular, people aged more than 50 years of age were overrepresented. As only very few persons below 18 years of age had opted into COVIDmeter, these persons were excluded from Table 1.
Weekly share with “possible COVID-19”
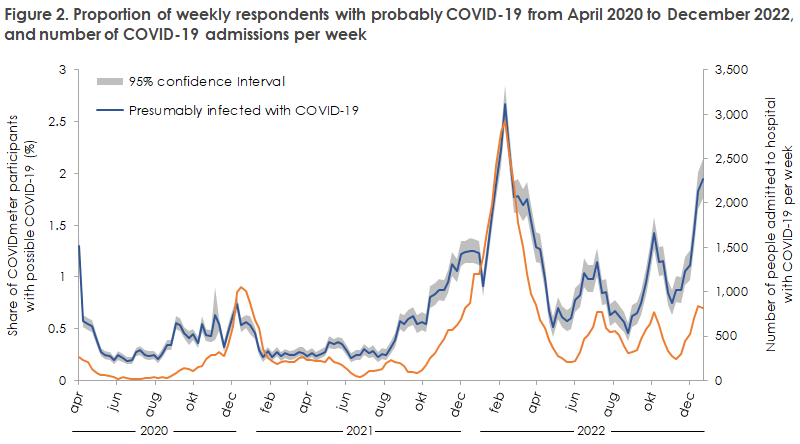
Every week, the share of completed questionnaires from participants who meet the case definition is calculated, i.e. the share who presumably have COVID-19. The below figures show this calculated share per week for the period from April 2020 to December 2022. In the figures, the share with possible COVID-19 is shown alongside the curve showing the weekly number of COVID-19 admissions. Overall, the COVIDmeter results and admission figures are associated.
Symptoms
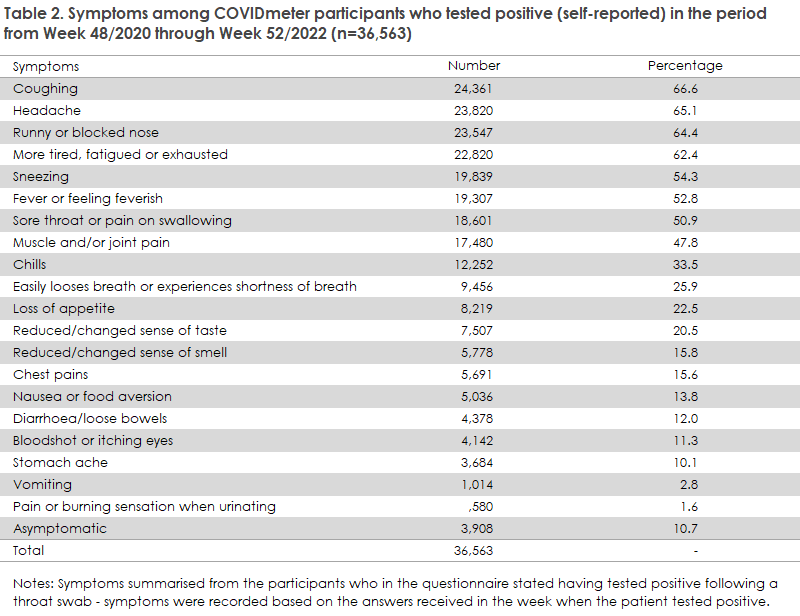
COVIDmeter provided information about a number of additional conditions. Thus, Table 2 shows the distribution of reported symptoms among participants who stated that they had tested positive to SARS-CoV-2 in the period in question. More than 60% of the participants who stated having tested SARS-CoV-2 positive reported coughing, headache, runny or blocked nose and feeling more tired, fatigued or exhausted, whereas more than 50% stated symptoms such as sneezing, fever or feeling feverish and sore throat or pain on swallowing; 11% stated being asymptomatic. As the distribution of participants is not representative of the Danish population, the results are unlikely to reflect the precise share of asymptomatic citizens in the population.
Interpretation and use
From the spring of 2020 to now, the COVIDmeter results have been used in the monitoring of COVID-19 and have, along with other available monitoring data, formed part of the overall assessment of the epidemic course and preventive measures. The results were published on the SSI website and have continuously also been published as part of the weekly overview of trends for COVID-19 and other airway infections. In this context, COVIDmeter results were interpreted with caution. The results were considered to express a trend rather than the precise share of infected people in the population. COVID-19 has a very wide and variable symptom picture. Symptom reporting alone does not provide sufficient information to diagnose the condition. The presence of other airway infections would also affect the results, which we needed to take into consideration when interpreting the results.
The system was clearly not representative of the entire Danish population - but we did not expect it to be from the outset. Frequently, a group of particularly interested citizens will contribute to data collection systems. The share of COVIDmeter participants with possible COVID-19 could therefore not be translated directly into a prevalence measure. In other words, the share of participants who had symptoms meeting the requirements of the case definition used was probably not equal to the share of the Danish population that actually had COVID-19. In contrast, a close association was observed between the curves showing COVIDmeter results and the number of COVID-19 admissions. More specifically; the weekly increases and decreases measured by the COVIDmeter showed if the real infection pressure increased or decreased. Therefore, the system could be used to obtain guidance and possibly also as an early warning tool. Future analyses of the data collected will provide a more precise picture of the strengths and drawbacks of the system.
Phasing out the system
After the COVID-19 epidemic concluded, an agreement was made to gradually reduce the various COVID-19 monitoring systems. This includes COVIDmeter, which will discontinue data collection as from 1 April 2023. This means that as from 1 April, the participating citizens will no longer be asked to provide symptom data.
The SSI takes this opportunity to express our gratitude to all citizens who have answered the COVIDmeter questions thereby contributing to the monitoring of COVID-19 in Denmark. COVIDmeter has been possible because a large number of citizens have faithfully, week after week, taken the time to log in and complete the questionnaire. It has been impressive to observe how large a support the system has enjoyed. We, from the SSI, are both proud and grateful for the support received in these past years.
Monitoring of symptoms of airway viruses will continue. Among others, via Influmeter; a voluntary reporting system similar to COVIDmeter, which has been used to monitor seasonal influenza from October to May as from 2014. Influmeter is operated by the SSI and forms part of a European collaboration to monitor airway viruses, coined Influenzanet. If you would like to contribute to Influmeter, you may find the information needed here.
We also take this opportunity to express our gratitude to the many contributing organisations. COVIDmeter was developed and maintained by NetCompany with considerable assistance from the Danish Agency for Digital Government, the Danish Health Data Authority and Sundhed.dk.
Further information about COVIDmeter is available at the SSI website.
(P.K. Munch, C.H. Hansen, C.A.W. Bruhn, S. Ethelberg, Department of Infectious Disease Epidemiology and Prevention)
22 March 2023