No 34 - 2016
Chlamydia 2015
Chlamydia 2015
Up to and including 2015, the laboratory notification system for chlamydia (oculo-genital infection caused by Chlamydia trachomatis) has been based on the statutory quarterly submission of data on laboratory-confirmed chlamydia made by the clinical microbiology departments and in recent years also from one clinical bio-chemistry department. In 2015, the data were also collected via The Danish Microbiology Database (the MiBa), and the presentation of chlamydia at Numbers and Charts (Tal og Grafer) has been Miba-based since January of 2015. The two surveillance systems differ on a number of important aspects.
The previous method
The data did not include the Danish civil registration number (the CPR number), and it was therefore not possible to determine the size of the share of the reported positive samples that was due to repeated testing episodes in the course of a single case in one person. The absence of the CPR number also meant that it was not possible to retrieve data on the patients’ municipality of residence. The municipal code that could be derived from the provider number or the classification code of the person requesting the test was therefore used as a surrogate marker for geographical location. No demographic information was available about the patients who tested negative, apart from information about the quarter during which the test had been made and the name of the laboratory performing the test. The tested population’s distribution on sex, age and anatomical sampling location could therefore not be described. As from the end of 2015, the previous method was replaced by use of MiBa-based data.
The method based on MiBa data
Data comprise all positive and negative chlamydia test results from the departments of clinical microbiology (DCM) extracted from the MiBa, including the patient’s CPR number to ensure that disease episodes in one person may be distinguished from episodes in other persons of the same sex and age. A new disease episode in the same person is defined by an interval exceeding 42 days between two positive testing episodes. In addition to the DCM’s one department of clinical biochemistry also performs chlamydia diagnostics. Based on the CPR, information is also obtained about the patients’ municipality of residence . Several negative test results within a single year in one individual are counted as a single negative testing episode.
Chlamydia occurrence recorded by each of the two methods
Below, we present the numbers achieved using the previous method exclusively, unless otherwise specified.
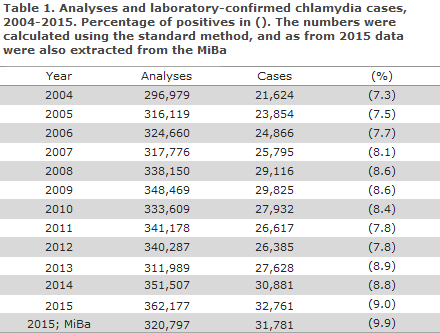
2015 saw the detection of 32,761 chlamydia cases (30,881 in 2014). This corresponds to an annual incidence of 579 per 105 (549 per 105 in 2014 and 493 per 105 in 2013). A total of 362,177 analyses were performed, and chlamydia was detected in 9.0% of those tested, Table 1. The share of positives increased in the 2004-2009 period from 7.3% to 8.6% and then decreased to 7.8 % in 2011 and 2012, and finally registered at 8.9% in 2013 and 8.8% in 2014.
Data extraction from the MiBa yielded a total of 31,781 cases and 320,797 performed analyses in 2015.
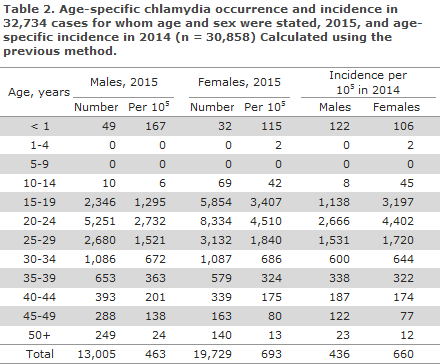
Among males, 79% (79% in 2014) were in the 15-29-year age group, Table 2, and among females, the corresponding share was 88% (87% in 2014).
Compared with 2014, both the sex- and age-specific incidences had increased in all age groups for males and for females, apart from modest decreases among the 10-14-year-olds seen for both sexes and for 25-29-year-old males.
The corresponding shares based on data extraction from the MiBa, Table 3, did not differ significantly from the above-mentioned shares, but the sex- and age-specific numbers and incidences were lower.
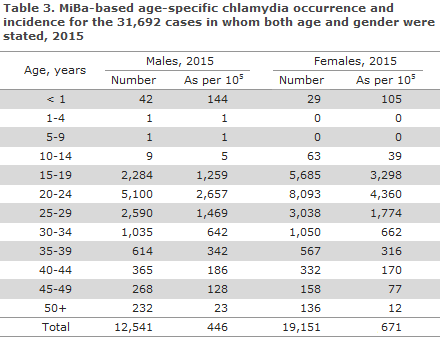
In 2015, the incidences for both males and females were higher than those recorded in the preceding year for nearly all 1-year age groups in the 15-29-year age range, Figure 1. The highest incidence among men was found in 22-year-olds (21-year-olds in 2014). In women, the highest incidence was found among 19-year-olds as in 2014. The same pattern was seen for 2015 based on MiBa data, Table 3. 39% of the diagnosed cases were observed in men. This share has increased steadily from 23% in 1994 to 38% in the 2009-2012 period.

Geographical distribution of chlamydia cases
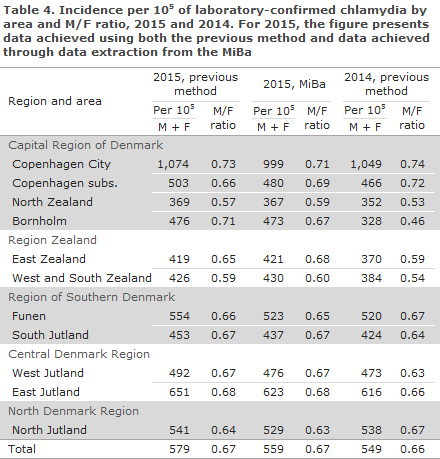
With the previous method, the patients’ geographical location was determined by reference to the municipality where the specimen was obtained . The corresponding areas of the country are shown in Table 4. For comparison, we also present the distribution by area based on the Danish Population Register municipality as determined from the MiBa data extraction and the patients’ CPR number.
Use of the MiBa produced lower numbers and therefore lower incidences than were observed using the previous method, except for the following: men in North Zealand and in all of Region Zealand and women on Bornholm and in West and South Zealand. One explanation for this finding may be that the person groups in question were more inclined than other groups to seek diagnostics and treatment in the City of Copenhagen than in their local areas of residence.
Using the previous method, the general pattern for 2015 compared with 2014 was an increase in the incidence recorded for both sexes in all regions and areas, except for men in the North Denmark Region, where a modest decrease was recorded.
Diagnostics
Assessed using the previous method
A total of 91% of the positive samples were submitted by GPs, 8% by hospitals. All cases were detected using nucleic acid amplification techniques. Chlamydia was detected in urine samples in 12,705 cases, i.e. 39% of all cases (37% in 2014 and 2013). Male samples constituted 86% of the positive urine samples (86% in 2014 and 87% in 2013). Urine was used as sample material in 84% of the male chlamydia cases (82% in 2014 and 2013). All laboratories reported positive findings in urine samples. Rectal chlamydia was detected in 334 men (306 in 2014 and 226 in 2013).
Assessed using MiBa data
All findings were virtually identical to the numbers presented above.
Chlamydia in children
Assessed using MiBa data
Chlamydia was found in 145 children below 15 years of age. Among these, 71 (49%) were less than 1 year old, of whom 69 (97%) had conjunctivitis. In the remaining two children, the sample was taken from the upper respiratory tract. One of these children was less than 1 month old and the other was 4 months old. Among 69 children below 1 year of age who had conjunctivitis, 59 were less than 1 month old, seven were 1 month old, one was 2 months old and another was 3 months old.
Urogenital chlamydia was detected in eight girls aged 13 years, 55 girls aged 14, and also in one 13-year-old and seven 14-year-old boys.
The incidence (number of cases per 105) among 10-14-year-olds decreased for girls from 127 in 2009 to 45 in 2014 and 42 in 2015, and for boys it decreased from 11 in 2009 to 8 in 2014 and 6 in 2015.
The tested population (based on MiBa data)
Age groups and sexes
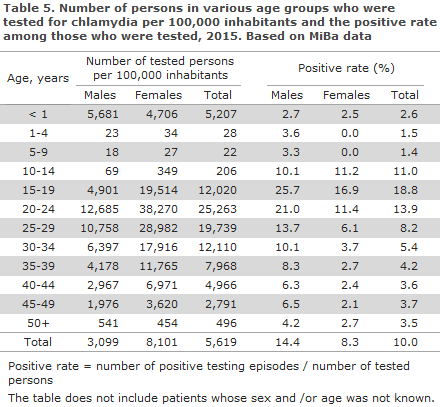
The number of tested persons per 105 by sex and age, Table 5, revealed a considerably lower number of men than women in all age-groups, except for the groups of 0-year-olds and ≥ 50-year-olds. The M/F ratio among the tested persons in the age groups from 20 years to 39 years was approx. 0.35. For comparison, the positive rate for men was approx. twice as high as the positive rate for women in the age groups from 20 years to 34 years, and it was approx. three times higher in the age groups from 35 years to 49 years. The positive rate for all tested individuals was 10%, but 14.4% for men and 8.3% for women.
Areas and sexes
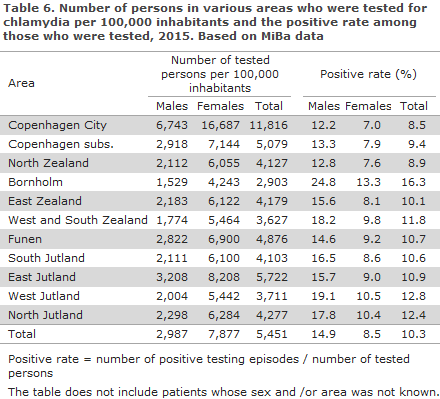
The number of tested persons per 105 by area and sex, Table 6, showed that in all areas the M/F ratio among the tested persons came very close to the number found for Denmark as a whole; 0.38. The areas of Copenhagen subs. and Funen recorded slightly higher ratios (0.41), whereas West and South Zealand recorded the lowest ratios (0.32). The positive rate was considerably higher on Bornholm, in West Jutland and in North Jutland than in Denmark as a whole, and somewhat lower in the City of Copenhagen, Copenhagen subs. and North Zealand.
The small differences in the total positive rate presented in Tables 5 and 6 are due to the fact that Table 5 excludes patients of unknown sex and/or age, whereas Table 6 excludes patients with unknown sex and/or unknown area.
Testing of men for rectal chlamydia
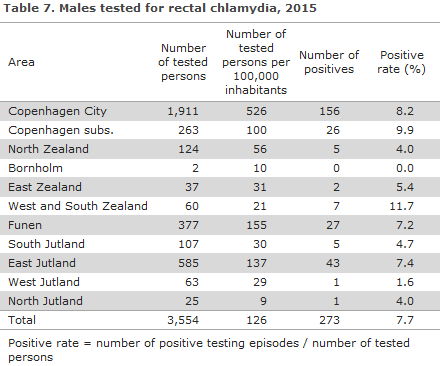
Considerable geographic variation was seen in the frequency of rectal testing of men, Table 7. The testing rate was higher than the national average in the City of Copenhagen, Funen and East Jutland, i.e. the areas that hold the three major Danish cities, but it was considerably lower in all other areas, apart from Copenhagen subs. The positive rate varied somewhat less. In areas where more than 100 men had been tested, the positive rate varied between 4.0% and 9.9%.
Commentary
In 2015, the number of chlamydia analyses was 3% higher and the number of detected cases was 6% higher than the corresponding figures for 2014, whereas the positive rate remained largely unchanged: 9.0% in 2015 and 8.8% in 2014.
For both sexes and in most age groups, a higher incidence was observed in 2015 than in 2014.
Like in 2009-2014, the male proportion of the detected cases had levelled off at nearly 40%, but there is no reason to believe that chlamydia is less prevalent among men than among women. Rather, chlamydia is detected in a larger share of the tested men than women. Increased testing of men should therefore also be encouraged in the future. The number of men who had rectal chlamydia detected increased further, but considerable geographical differences exist in the use of rectal sampling. When rectal chlamydia is found in a man, he should also be tested for syphilis, gonorrhoea and lymphogranuloma venereum (LGV), EPI-NEWS 20/08.
This is the last chlamydia report statemen t to be based on data that were actively reported by the diagnosing laboratories. Henceforth, the monitoring will be based on semi-automatic extractions from the MiBa that will also inform Numbers and Charts (Tal og Grafer) with current data. The present report shows some fundamental and, in part, expected differences between the results produced by each of the two surveillance methods. For instance, the MiBa-based statement yields a lower number of detected cases because repeated positive testing episodes within a 42-day interval in a single patient are counted as a single rather than as several episodes. Correspondingly, the number of testing episodes was lower because several negative testing episodes within a year are counted as a single negative testing episode. As the MiBa includes data on patients whose test results were negative, it will henceforth be possible to compare updated demographic data for the entire population and therefore to assess to which degree changes in the incidence of laboratory-confirmed chlamydia are caused by real changes in chlamydia incidence or by changes in testing strategies.
(S. Hoffmann, Microbiology and Infection Control, L. Espenhain, J. Kähler, Department of Infectious Disease Epidemiology)
Link to previous issues of EPI-NEWS
24 August 2016